Is visual data really richer than text?
I built a toy world in which a picture of a flying ball and a list of numbers that describe it carry exactly the same information. Then I trained models of the same size to predict where the ball goes next. The model that saw pictures beat the model that read symbols. Both lost to the model that read plain numbers. Then I removed the convolution from the picture model, and its advantage was gone. That last result is the real answer.
The claim
The argument is usually made with numbers. Yann LeCun states it most clearly.
Language is low bandwidth. A person reads about 4.5 words each second. At about two bytes for each token, that is less than 12 bytes each second. Vision is different. Two optic nerves have about a million fibres each, and each fibre carries about 10 bytes each second. A four-year-old who was awake for 16,000 hours took in about 1015 bytes. A large language model trained on 1013 tokens saw about 2 × 1013 bytes. So in four years a child sees fifty times more data than the largest model trained on all the text of the internet.
The conclusion from this is strong. Text alone cannot lead to human-level machine intelligence, because text does not carry enough. If you want a system that understands how the world behaves, you must let it watch the world.
Be careful about what the argument says. LeCun does not say that bytes are information. He has said explicitly that the visual signal is more redundant than text, and that self-supervised learning needs this redundancy to work.
So the claim that I test is not “video has more bytes, so video is better”. The claim is this: the form of high-bandwidth sensory data lets a model discover structure, and a compact symbolic encoding does not.
Hypothesis
With real data, you cannot test this cleanly. Vision and text never describe the same thing. A video of a falling ball and the sentence “a ball fell” differ in content, not only in format. Any comparison mixes the representation with the thing it represents.
So build a world where they cannot differ. Suppose that the numbers fully decide the image, and the image fully decides the numbers. Then the two representations carry the same information by construction. In that world:
- If the advantage of pixels comes from information, it must disappear. Neither model can see anything that the other cannot.
- If the picture model still wins, the advantage comes from something else: the shape of the representation, or what the architecture that reads it assumes.
The second result is the one that happened. But it came with a surprise.
Setup
The world is a grid of 32 × 32 pixels. A ball is launched from a random position near the bottom left, with a random speed, angle and gravity. It follows a parabola. I only keep launches for which the complete flight stays in the frame, so nothing is cut off.
At each step, the position of the ball is rounded to the nearest pixel. This rounding makes the comparison exact. The frame shows a small disc with its centre on that pixel. The disc is drawn from the two integers (col, row) and from nothing else. So the image contains exactly the information in those two integers: no detail below a pixel, no shading, no blur.
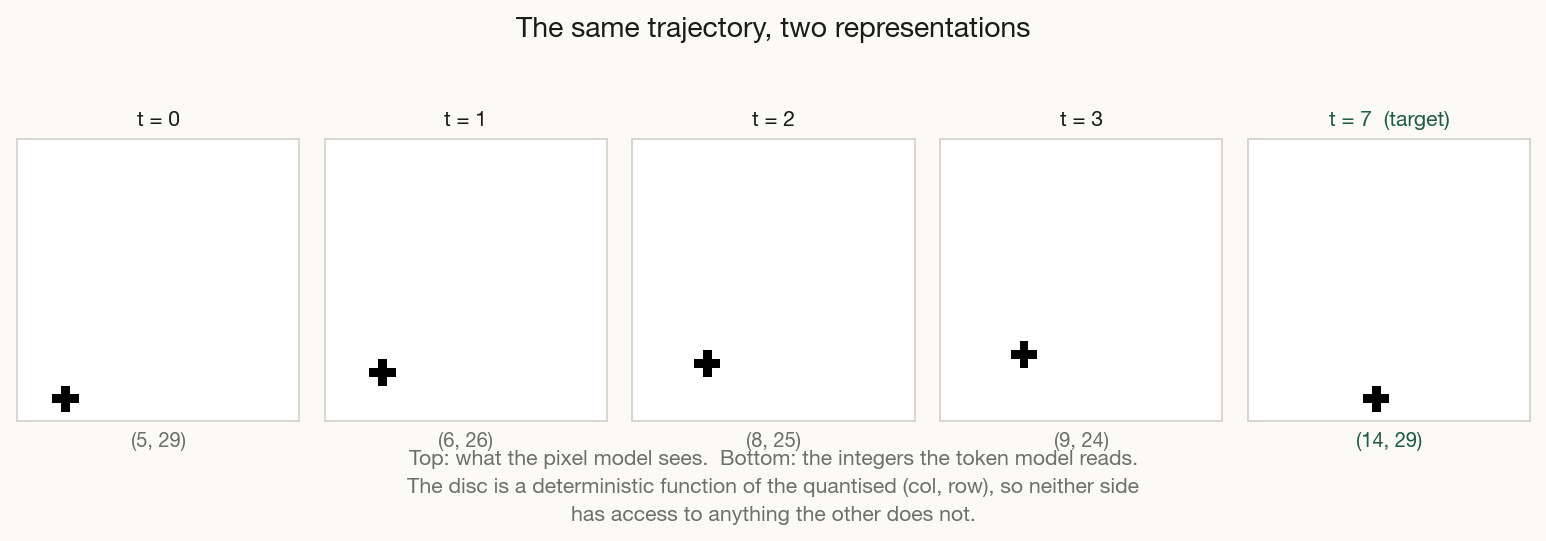
The task. The model sees 4 steps. It must predict the position 4 steps after the last one. Four observations are enough to fix the flight, so this is not a guessing game. The question is whether a model can find the curve, and how much data it needs.
The models. Three models predict the same target with the same loss. They have the same number of parameters to within 0.2 % (about 147,000 each), and they train for the same 2,500 steps:
- pixels: a small convolutional network that reads the four frames. A convolutional network is made for images. It assumes that pixels near each other belong together.
- tokens: the same positions as symbols with no meaning. Each column and each row has its own entry in a table. Nothing tells the model that 12 is next to 13. It must discover the order, as the picture model must.
- numeric: the same positions as ordinary numbers. Here the model gets the order for free.
The first two are the fair comparison: neither is told the geometry. The third is a control, and it became the most important one. If “text” means symbols whose meaning you must learn, that is tokens. If it means numbers whose order already means something, that is numeric. The original question puts the two together, and that is where it goes wrong.
I chose the learning rate for each model with a pilot on validation data only. Each number below is the test error on 4,000 flights that the model did not see, as an average of 3 seeds. The unit is pixels, so the number means something physical.
Experiment
The table shows the test error in pixels, with one standard deviation. Lower is better. The fourth column is a control that I explain below: the same frames, read by a plain network with no convolution.
| training flights | numeric | pixels, with convolution | pixels, no convolution | tokens |
|---|---|---|---|---|
| 125 | 2.25 ± 0.12 | 3.27 ± 0.20 | 4.19 ± 0.11 | 4.74 ± 0.12 |
| 250 | 2.10 ± 0.01 | 2.98 ± 0.03 | 3.46 ± 0.15 | 3.60 ± 0.11 |
| 500 | 2.06 ± 0.01 | 2.48 ± 0.06 | 3.07 ± 0.16 | 3.10 ± 0.10 |
| 1000 | 2.02 ± 0.01 | 2.35 ± 0.05 | 2.71 ± 0.06 | 2.78 ± 0.09 |
| 2000 | 2.00 ± 0.00 | 2.23 ± 0.03 | 2.41 ± 0.03 | 2.54 ± 0.00 |
| 4000 | 1.99 ± 0.01 | 2.14 ± 0.01 | 2.25 ± 0.02 | 2.33 ± 0.02 |
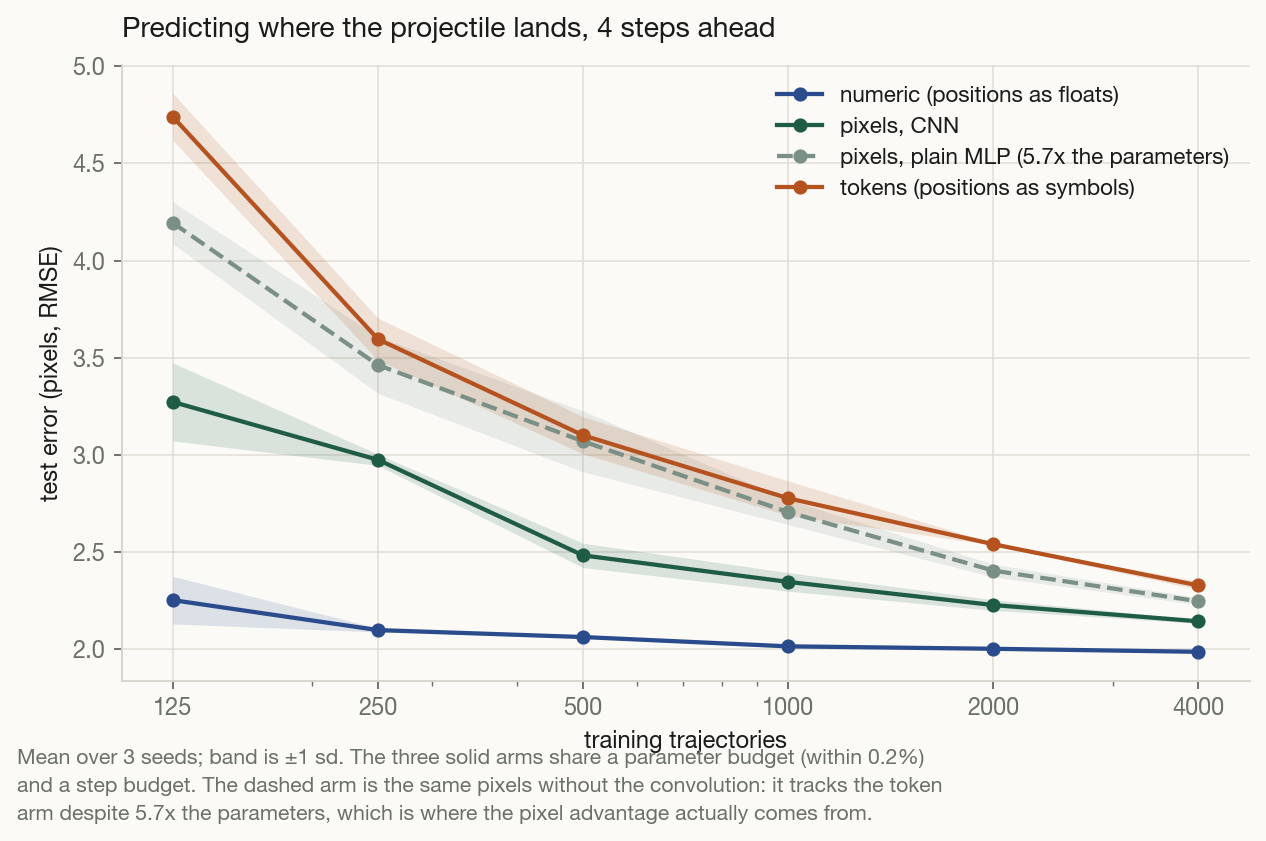
The table says three things.
Pixels beat tokens at every size. With 125 flights the difference is 1.47 pixels, a third of the error. So the intuition behind the claim is not empty. With the same information, an image helped more than symbols whose order the model must discover.
Numbers beat pixels at every size, and much sooner. The numeric model is at 2.25 pixels with 125 flights. The picture model does not reach that with 2,000. The numeric model stops at about 2.0 pixels after 250 flights and does not improve. I take this as the floor of the task: each position is rounded to a whole pixel, and the rounding removes information that no model can get back. The numeric model reaches the floor with a twentieth of the data. The other two never reach it.
The advantage of pixels over tokens does not fade. In pixels, the difference gets smaller with more data: 1.47, 0.62, 0.62, 0.43, 0.31, 0.19. At first I read this as an advantage that fades. That reading is wrong. Both curves approach the same floor, so the difference must get smaller, whatever the cause. Now measure the error above the floor. The token model has 2.14, 1.63, 2.25, 2.20, 2.30 and 2.18 times the error of the picture model: a constant factor of about 2.2 at every size. Two curves that approach a ceiling always get closer. That is not evidence of anything, and I should not have reported it as evidence.
The controls
Three objections need an answer before the conclusion.
Did the cheap models train too little? One run of the picture model takes 195 seconds. One run of each of the other two takes 7 seconds. With the same number of steps, the picture model gets about 26 times the compute. So I trained the token and numeric models again with four times the steps, on 4,000 flights. Nothing changed: tokens went from 2.33 to 2.36 pixels, and numeric from 1.99 to 2.00. Both had finished learning. The picture model uses 26 times the compute and comes second.
Is the task trivial? No. Fit a curve through the four rounded observations and extend it. That is the exact physics, applied without care, and it gives an error of 6.03 pixels. Every trained model is much better. The rounding makes the simple extension unstable, and the models learn which launches are probable to correct for it. They learn real structure.
Is “pixels beat tokens” a fact about pixels at all? This is the important one, and I almost did not run it. A different architecture reads each representation. The picture model is a convolutional network. The other two are plain networks. So the result could be a fact about convolutions.
The test is to give the same frames to a plain network, with no knowledge of space in its architecture. To give it every chance, I kept the width of the other plain networks, which makes it much larger: 841,678 parameters against about 147,000. It still lost. And it lost to almost exactly the level of the token model: 3.07 against 3.10 pixels with 500 flights, and 2.25 against 2.33 with 4,000.
That is the complete result in one line. Remove the convolution, and pixels are worth almost nothing more than symbols with no meaning, with 5.7 times the parameters.
Conclusion
The claim was that high-bandwidth sensory data lets a model discover structure, and a compact symbolic encoding does not. In a world where the two carry the same information, the most compact encoding won, with a twentieth of the data.
The control gives the sharper finding. Pixels beat tokens by a factor of about 2.2 in error above the floor, at every training size. All of that advantage disappears when the convolution is removed. The images are the same and the information is the same. With no architecture made for space, the result falls back to the token model.
So the advantage was never in the pixels. It was in the fit between the representation and the thing that reads it. The three representations differ in one respect: how much of the order of positions they make available, and to what.
- numeric states the order directly. 12 and 13 are neighbours, and 14 is twice as far, because that is what numbers mean. Any network can use it at once.
- pixels encode the order in space. Positions 12 and 13 give almost the same image. That is only useful to an architecture that is made to use local structure. To a convolution it is a large head start. To a plain network it is nothing.
- tokens hide the order completely. Two neighbouring positions are two unrelated rows in a table. The model must spend data to discover the number line before it can do any physics.
This makes “are pixels richer than text?” the wrong question. Richness is not a property of a representation alone. It is a property of a representation together with the machinery that reads it. The same frames are worth a factor of two or nothing, and the reader decides which.
The argument from byte counts does not survive this. It predicts that the richest representation wins. Here the leanest one won, and the fit to the architecture decided the order of the others, not the volume. The argument from redundancy does better. An image is a redundant encoding, and its redundancy carries the geometry. But the control shows that redundancy is only useful when something is built to use its particular shape. That is a real claim about what architectures assume. It is much narrower than a claim about bandwidth.
Limitations
- This is a toy world. The property that makes the test clean also makes it narrow. Five numbers fully describe a flight, so a lossless symbolic encoding exists. For a photograph of a street, no such encoding exists. This experiment can rule out one claim: that pixels help because they carry more information. It cannot tell you what happens when they do carry more.
- The models are small and the task is one step. Nothing here is about long sequences, objects that interact, or objects that hide each other. In those cases a visual model could have advantages that this setup cannot show.
- Other architectures would move the numbers. A transformer over the sequence of tokens, or a different convolutional network, would give different results. An equal number of parameters is one idea of fairness, not the only one. That is why the compute control above matters.
- The task is almost linear for the numeric model. This is the largest limitation. The ideal prediction from four exact observations is a fixed linear combination of them, plus a correction for the rounding. A plain network learns that easily. So the win of the numeric model is much less of a discovery than it looks: I chose a task that is simple in exactly that representation. The comparison of pixels with tokens does not have this problem, because neither gets the order for free. That is why the control matters more than the headline.
- The token model is a hard version of “text”. I gave it no information about order at all. A real tokeniser is kinder: “13” and “14” share a character, and an encoding by digits gives away a good part of the order. A model that reads digits would land between my token model and my numeric model. Remember this before you read the result as a statement about language models.
- The floor compresses the differences. The numeric model reaches the floor after 250 flights. After that, the others can only approach it. A harder task, with a longer prediction, a finer grid or several balls, would separate the three models more. That is the next thing to run.
Run it yourself
The quickest way is the notebook. Open it in Colab and it runs in your browser, with nothing to install. It shows one flight in all three forms, trains the models in a short run of about a minute, and draws the figure from the saved results of the full run.
To run the full experiment on your own machine, you need PyTorch, NumPy and Matplotlib. It runs on a CPU and takes about an hour.
pip install torch numpy matplotlib
python pixels_vs_tokens.py smoke   # two or three minutes, checks the setup
python pixels_vs_tokens.py run     # the full experiment -> results.json
python control_flat_pixels.py      # the control that decides it
python viz.py                      # the figures and the table
The code is here: pixels_vs_tokens.py, control_flat_pixels.py and viz.py, with the results of every run.
Two things to change. The size of the grid sets how coarse the rounding is, and so how much noise the models must work against. HORIZON sets how far ahead the prediction goes, and how much the errors grow.
Sources
- The claim, from the person who states it most clearly: Yann LeCun on language as a low-bandwidth channel, on a four-year-old who has seen fifty times more data than a language model, and on why redundancy helps self-supervised learning.